What Is Warehouse Automation ROI
Warehouse Automation ROI is the financial return an investment in warehouse and assembly automation produces. It is measured as the labor, space, accuracy, and throughput gains it delivers against what it costs to buy, install, and run. A strong ROI case turns an operational hunch into a number your CFO can approve.
You already know the operation needs it. Picking labor is expensive and hard to keep. Accuracy drifts. Throughput hits a ceiling. The floor is full. What stalls the project is rarely the operational case. It is the financial one.
This guide is for the operations and finance leaders who build that case together. It covers what automation ROI measures, the five metrics finance uses to judge it, how financing structure changes the return, and how to make the numbers defensible before you pitch.
On this page
What Warehouse Automation ROI Really Measures
Automation ROI is not one number. It is the sum of several gains, and most cases capture some while missing others. Understanding each driver helps you build a complete case rather than a thin one.
There is also a deeper split worth naming up front. Some of automation’s value is cost avoidance, meaning savings you can measure and put in a spreadsheet cell. Some of it is opportunity value, meaning new margin the operation earns once freed space and labor go to higher-value work. Cost avoidance is easier to prove. Opportunity value is usually larger. Keep both in view.
Labor. The most cited driver. Automation reduces the headcount required to pick, pack, and replenish, and it eases the pressure of finding and keeping reliable staff. Break labor down by function rather than using one blended rate. Picking, packing, and replenishment each automate differently and save differently.
Space. Often the largest driver and the most overlooked. High-density storage can recover a large share of your footprint. That recovered space defers a building expansion or avoids a lease, costs that frequently dwarf the labor savings. We keep space out of quick calculators on purpose, because its value depends entirely on what you do with the room you get back.
Accuracy and throughput. Automation lifts order accuracy and raises the ceiling on how much you can move in a day. Fewer errors mean lower rework and return costs. Higher throughput means you meet demand without adding shifts.
Growth capacity. A system sized for today alone is undersized. Good ROI cases model order and line growth over five to seven years because automation that absorbs growth without added labor keeps paying long after payback.
Opportunity value. The largest gain is often the hardest to measure. It is what you do with the space and labor automation frees up. Recovered space can host kitting, additional product line inventory, value-added services, insourced work, or new product lines. Freed operators move from picking to exception handling and quality. Because this value depends on your business, not the equipment, most cases record it as zero, which is almost always wrong. This driver deserves its own analysis, and we treat it in depth separately.
The Five Metrics Finance Uses to Judge Warehouse Automation ROI
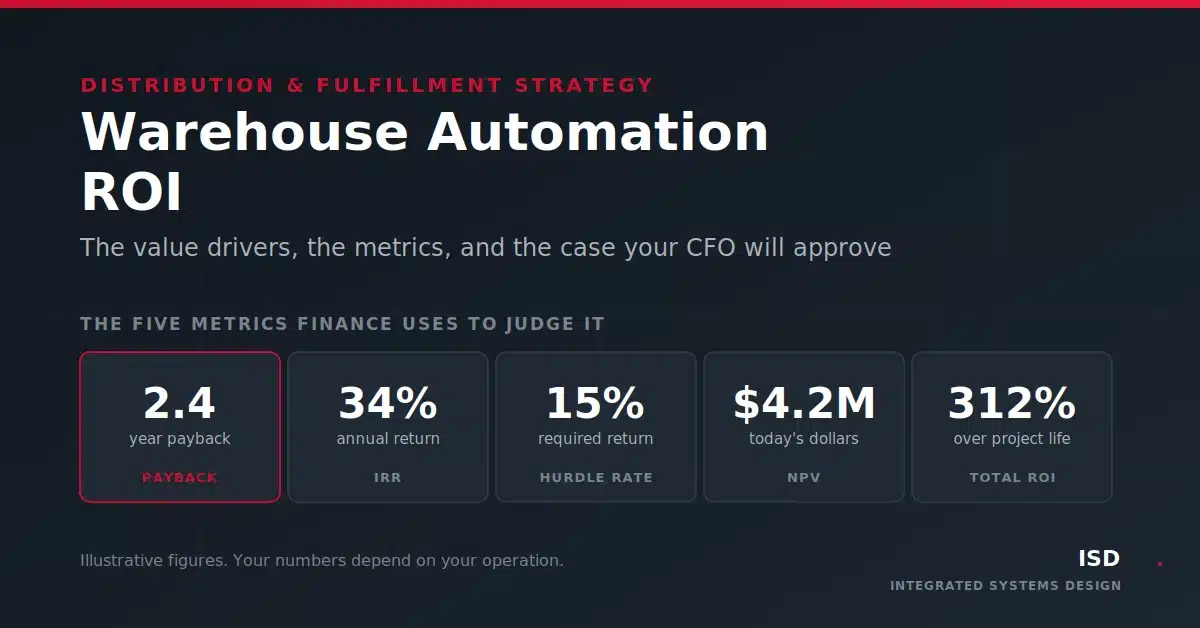
Operations leaders think in FTEs and pick rates. Finance thinks in five metrics. Learn them before you walk into the capital request meeting.
Payback period. How long until the project pays for itself? A three-year payback means cumulative savings equal the investment by year three. Shorter is better.
IRR (Internal Rate of Return). The annual percentage return the project earns on invested capital. A 25% IRR behaves like a 25% annual yield.
Hurdle rate. The minimum return your company requires to approve any capital project. It reflects the cost of capital plus a risk premium. This is a separate gate, not a metric folded into the others. If your project’s IRR beats the hurdle rate, you clear the bar. If it falls below, the project gets rejected, no matter how strong the operational story.
NPV (Net Present Value). The project’s total value in today’s dollars, with future savings discounted back to present value. Positive NPV creates value. Negative NPV destroys it.
Total ROI. The full return over the project’s life is expressed as a percentage of the original investment. A 300% total ROI returns three dollars for every one spent.
For a full walkthrough of how these five numbers work together and how to present them, see our Warehouse Automation ROI Calculator guide.
Why Simple ROI Math Understates the Case
Most operations leaders build their first ROI pass in a spreadsheet. That is a fair start. It is also where projects quietly lose their margin.
Back-of-envelope models usually count labor savings only. They apply a single blended labor rate that hides where savings come from. They skip accuracy gains and error costs. They ignore order growth. They rarely discount future cash flows to present value. Each omission understates the return, and a thin case is easy for finance to reject.
The bigger risk is the opposite error, a case built on numbers that are too aggressive. A system sized wrong, or labor assumptions that will not hold, produces a return that collapses in review.
This scenario is where an experienced integrator earns its keep. ISD once told a beauty distributor that we could not quote the system that another integrator had sold them.
“Customers need a partner who is going to be honest with them. One who will not recommend the easiest solution, but the right one.”
Tony Morgott, President, ISD
The proposed system relied on carton flow; the product mix did not fit. In one-foot-wide, eight-foot-deep lanes, small items like nail polish and files left 95% of the space empty. The design would have forced more walking, cut pick rates, and required an extra shift, cannibalizing the very ROI the automation was meant to deliver. ISD redesigned it with a mix of technologies matched to each part of the operation. The honest number was the useful one. Read the full story in Will Automation Pay Off? 3 Ways to Reduce Risk and Increase Predictability.
How Financing Structure Changes the Return
The same system can post quite different returns depending on how you pay for it. CapEx, OpEx, leasing, and hybrid structures shift when cash goes out and how the return reads on paper.
A capital purchase carries the full cost upfront and often the strongest total-cost position. Low-upfront models like leasing, subscription, and usage-based pricing spread the cost. They can post a high IRR precisely because the initial outlay is small, even when the total paid is higher. That is why IRR alone can be misleading.
A financing choice is a strategy decision, not just a finance formality. For a full comparison of the five structures and how each behaves, see our guide to warehouse automation financing. To go deeper on the ownership-versus-subscription choice, see our guide to CapEx vs OpEx warehouse automation. And because subscription models carry costs that never appear on the quote, review the hidden costs of RaaS and SaaS warehouse automation.
See your numbers in about 10 minutes
Enter your facility’s operating data and get payback, IRR, NPV, and total ROI in a board-ready PDF.
What Good ROI Looks Like
There is no universal target. A good return is one that beats your hurdle rate and stays positive on NPV across the analysis period. That said, many operations aim for a payback window in the two-to-four-year range and an IRR comfortably above their cost of capital.
Documented ISD implementations show the range. In one project, a distribution center doubled its capacity and saved $660,000 a year in labor it would otherwise have added while recovering 30% of its floor space for future growth. In a documented ecommerce implementation, ISD delivered a 22-month payback, eliminated 18 picking positions, and enabled the cancellation of a planned $12 million facility expansion. Results vary by operation and scale. The point is not the specific figures. It is that a complete case captures labor, space, and avoided cost together, not labor alone.
How ISD Builds a Defensible ROI Case
A number is only as strong as the analysis behind it. ISD builds ROI cases the way finance builds them, sourced, sensitivity-tested, and matched to your actual operation.
Every recommendation starts with our OptimalOps-Process framework. It analyzes your current operation, models future requirements, and designs the right configuration before a single component is specified. Different technologies produce different ROI profiles, and we match the technology to your data rather than to a catalog.
“No one manufacturer does everything extremely well. In the same facility, we might work with four different manufacturers of conveyors alone, because those are what fit best. We tailor the system to your operation, not your operation to the system.”
Tony Morgott, President, ISD
That brand-agnostic approach matters for ROI. A system built around what a single manufacturer sells will optimize for that catalog, not for your return. A system built around your operation optimizes for the number your CFO cares about.
“A calculator gives you a defensible number. A conversation gives you a defensible strategy. The cheapest part of the project to justify is the labor line. The part that changes the business is what you build in the space you get back, and that is the number no calculator hands you.”
Bob Jones, Senior Consultant, ISD
Run Your Numbers
Start with the Warehouse Automation ROI Calculator. Enter your facility’s operating data and you will see your payback period, IRR, NPV, and total ROI in about 10 minutes. A PDF arrives in your inbox, and you can re-run scenarios anytime.
When you are ready to pressure-test the results and build a full, board-ready case, contact ISD’s Bob Jones, Senior Consultant. Call 248-668-8250 or email information@isddd.com and ask for Bob. We will refine your numbers, stress-test the assumptions, and map the sequence of investments that deliver the fastest payback.
Warehouse Automation ROI: Questions and Answers
What is a good ROI for warehouse automation?
It depends on your hurdle rate, not a universal number. Many operations target a payback period in the two-to-four-year range and an IRR comfortably above their cost of capital. A project clears the bar when its IRR beats the hurdle rate and its NPV is positive across the analysis period. Run your own figures rather than trusting an industry average.
How is warehouse automation ROI calculated?
Start with the annual benefit, meaning labor saved, accuracy gained, space recovered, and throughput added, then weigh it against the total cost of ownership: equipment, installation, integration, training, and maintenance. Convert the future benefit into today’s dollars with a discount rate. The result feeds payback, IRR, NPV, and total ROI.
What drives the biggest ROI in a warehouse automation project?
The largest gain is often the hardest to measure: the value of redeploying freed space and labor toward higher-margin work. Cost avoidance is straightforward since recovered space defers a building and reduced labor lowers payroll. But the bigger return comes when that recovered capacity hosts new revenue: kitting, value-added services, insourced work, or new product lines. Freed operators move from picking to exception handling and quality. Because this opportunity value depends on what you do with the capacity, most ROI cases record it as zero, which is almost always wrong.
Why do automation projects with a strong operational case still get rejected?
Because operations and finance speak different languages. Operations brings labor estimates and equipment quotes. Finance wants IRR, NPV, and payback against a hurdle rate. Without those metrics structured the way finance evaluates every capital request, a sound project stalls at the CFO’s desk.
Does financing structure change warehouse automation ROI?
Yes. CapEx, OpEx, leasing, and hybrid structures shift when cash is spent and how the return reads. Low-upfront models can post a high IRR because the initial outlay is small, even when total cost is higher. Compare structures on total cost and NPV, not IRR alone.
How accurate is a warehouse automation ROI calculator?
A good calculator gives a defensible first number in about 10 minutes, accurate enough to decide whether a project deserves a full study. For multi-technology projects or investments above roughly $5 million, finance will want sensitivity analysis and a sourced benefits breakdown that a calculator alone cannot produce.
Build your CFO-ready case
Run the ROI Calculator, then talk to ISD to pressure-test the numbers.